Back منقح Arabic Sazlayıcı Azerbaijani Pembibis (kumpiuter) BEW Дебъгер Bulgarian Debugger BS Depurador Catalan Debugger Czech Debugger Danish Debugger German Αποσφαλματωτής Greek
This article has multiple issues. Please help improve it or discuss these issues on the talk page. (Learn how and when to remove these messages)
|
| Part of a series on |
| Software development |
|---|

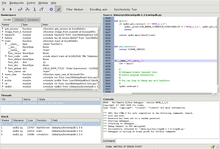
A debugger is a computer program used to test and debug other programs (the "target" programs). Common features of debuggers include the ability to run or halt the target program using breakpoints, step through code line by line, and display or modify the contents of memory, CPU registers, and stack frames.
The code to be examined might alternatively be running on an instruction set simulator (ISS), a technique that allows great power in its ability to halt when specific conditions are encountered, but which will typically be somewhat slower than executing the code directly on the appropriate (or the same) processor. Some debuggers offer two modes of operation, full or partial simulation, to limit this impact.
A "trap" occurs when the program cannot normally continue because of a programming bug or invalid data. For example, the program might have tried to use an instruction not available on the current version of the CPU or attempted to access unavailable or protected memory. When the program "traps" or reaches a preset condition, the debugger typically shows the location in the original code if it is a source-level debugger or symbolic debugger, commonly now seen in integrated development environments. If it is a low-level debugger or a machine-language debugger it shows the line in the disassembly (unless it also has online access to the original source code and can display the appropriate section of code from the assembly or compilation).