Back انحراف ربيعي Arabic Amplitud interquartílica Catalan مەودای چواریەکی CKB Interquartilsabstand (deskriptive Statistik) German Rango intercuartílico Spanish Kuartil arteko ibiltarte Basque دامنه بین چارکی Persian Écart interquartile French טווח בין-רבעוני HE Jangkauan interkuartil ID

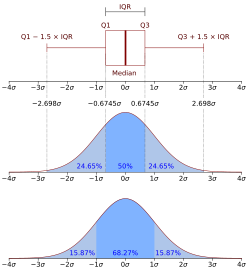
In descriptive statistics, the interquartile range (IQR) is a measure of statistical dispersion, which is the spread of the data.[1] The IQR may also be called the midspread, middle 50%, fourth spread, or H‑spread. It is defined as the difference between the 75th and 25th percentiles of the data.[2][3][4] To calculate the IQR, the data set is divided into quartiles, or four rank-ordered even parts via linear interpolation.[1] These quartiles are denoted by Q1 (also called the lower quartile), Q2 (the median), and Q3 (also called the upper quartile). The lower quartile corresponds with the 25th percentile and the upper quartile corresponds with the 75th percentile, so IQR = Q3 − Q1[1].
The IQR is an example of a trimmed estimator, defined as the 25% trimmed range, which enhances the accuracy of dataset statistics by dropping lower contribution, outlying points.[5] It is also used as a robust measure of scale[5] It can be clearly visualized by the box on a box plot.[1]
- ^ a b c d Dekking, Frederik Michel; Kraaikamp, Cornelis; Lopuhaä, Hen Paul; Meester, Ludolf Erwin (2005). A Modern Introduction to Probability and Statistics. Springer Texts in Statistics. London: Springer London. doi:10.1007/1-84628-168-7. ISBN 978-1-85233-896-1.
- ^ Cite error: The named reference
Uptonwas invoked but never defined (see the help page). - ^ Cite error: The named reference
ZKwas invoked but never defined (see the help page). - ^ Ross, Sheldon (2010). Introductory Statistics. Burlington, MA: Elsevier. pp. 103–104. ISBN 978-0-12-374388-6.
- ^ a b Kaltenbach, Hans-Michael (2012). A concise guide to statistics. Heidelberg: Springer. ISBN 978-3-642-23502-3. OCLC 763157853.