Back جدول الحياة Arabic Úmrtnostní tabulky Czech Sterbetafel German Tablas de mortalidad Spanish Elutabel Estonian Table de mortalité French לוח תמותה HE वय सारणी Hindi Tabel mortalitas ID Tavola di mortalità Italian
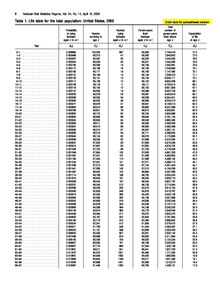
In actuarial science and demography, a life table (also called a mortality table or actuarial table) is a table which shows, for each age, the probability that a person of that age will die before their next birthday ("probability of death"). In other words, it represents the survivorship of people from a certain population.[1] They can also be explained as a long-term mathematical way to measure a population's longevity.[2] Tables have been created by demographers including John Graunt, Reed and Merrell, Keyfitz, and Greville.[2]
There are two types of life tables used in actuarial science. The period life table represents mortality rates during a specific time period for a certain population. A cohort life table, often referred to as a generation life table, is used to represent the overall mortality rates of a certain population's entire lifetime. They must have had to be born during the same specific time interval. A cohort life table is more frequently used because it is able to make a prediction of any expected changes in the mortality rates of a population in the future. This type of table also analyzes patterns in mortality rates that can be observed over time.[3] Both of these types of life tables are created based on an actual population from the present, as well as an educated prediction of the experience of a population in the near future.[3] In order to find the true life expectancy average, 100 years would need to pass and by then finding that data would be of no use as healthcare is continually advancing.[4]
Other life tables in historical demography may be based on historical records, although these often undercount infants and understate infant mortality, on comparison with other regions with better records, and on mathematical adjustments for varying mortality levels and life expectancies at birth.[5]
From this starting point, a number of inferences can be derived.
- The probability of surviving any particular year of age
- The remaining life expectancy for people at different ages
Life tables are also used extensively in biology and epidemiology. An area that uses this tool is Social Security. It examines the mortality rates of all the people who have Social Security to decide which actions to take.[3]
The concept is also of importance in product life cycle management.
All mortality tables are specific to environmental and life circumstances, and are used to probabilistically determine expected maximum age within those environmental conditions.
- ^ Harper, Begon. "Cohort Life Tables". Tiem. Retrieved 9 February 2015.
- ^ a b "Life Table: Meaning, Types and Importance". Sociology Discussion - Discuss Anything About Sociology. 2016-07-21. Retrieved 2018-03-30.
- ^ a b c Bell, Felicitie. "LIFE TABLES FOR THE UNITED STATES SOCIAL SECURITY AREA 1900–2100". Social Security. Retrieved 9 February 2015.
- ^ Silcocks, P. B. S.; Jenner, D. A.; Reza, R. (2001-01-01). "Life expectancy as a summary of mortality in a population: statistical considerations and suitability for use by health authorities". Journal of Epidemiology & Community Health. 55 (1): 38–43. doi:10.1136/jech.55.1.38. ISSN 0143-005X. PMC 1731769. PMID 11112949.
- ^ Saskia Hin, The Demography of Roman Italy, Cambridge University Press, 2013, pp. 104–118.