Back مقياس رسم Arabic Miqyas (xəritə) Azerbaijani Маштаб Byelorussian Мащаб Bulgarian पैमाना (नक्शा) Bihari স্কেল (মানচিত্র) Bengali/Bangla Skeul (kenfeur) Breton Razmjera BS Escala (proporció) Catalan Měřítko mapy Czech


The scale of a map is the ratio of a distance on the map to the corresponding distance on the ground. This simple concept is complicated by the curvature of the Earth's surface, which forces scale to vary across a map. Because of this variation, the concept of scale becomes meaningful in two distinct ways.
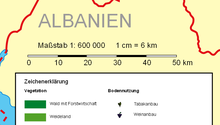
The first way is the ratio of the size of the generating globe to the size of the Earth. The generating globe is a conceptual model to which the Earth is shrunk and from which the map is projected. The ratio of the Earth's size to the generating globe's size is called the nominal scale (also called principal scale or representative fraction). Many maps state the nominal scale and may even display a bar scale (sometimes merely called a "scale") to represent it.
The second distinct concept of scale applies to the variation in scale across a map. It is the ratio of the mapped point's scale to the nominal scale. In this case 'scale' means the scale factor (also called point scale or particular scale).
If the region of the map is small enough to ignore Earth's curvature, such as in a town plan, then a single value can be used as the scale without causing measurement errors. In maps covering larger areas, or the whole Earth, the map's scale may be less useful or even useless in measuring distances. The map projection becomes critical in understanding how scale varies throughout the map.[1][2] When scale varies noticeably, it can be accounted for as the scale factor. Tissot's indicatrix is often used to illustrate the variation of point scale across a map.
Cite error: There are <ref group=lower-alpha> tags or {{efn}} templates on this page, but the references will not show without a {{reflist|group=lower-alpha}} template or {{notelist}} template (see the help page).
- ^ Snyder, John P. (1987). Map Projections - A Working Manual. U.S. Geological Survey Professional Paper 1395. United States Government Printing Office, Washington, D.C.This paper can be downloaded from USGS pages. It gives full details of most projections, together with introductory sections, but it does not derive any of the projections from first principles. Derivation of all the formulae for the Mercator projections may be found in The Mercator Projections.
- ^ Flattening the Earth: Two Thousand Years of Map Projections, John P. Snyder, 1993, pp. 5-8, ISBN 0-226-76747-7. This is a survey of virtually all known projections from antiquity to 1993.