| Timeline of the 2020 Pacific hurricane season | |||||
|---|---|---|---|---|---|
 Season summary map | |||||
| Season boundaries | |||||
| First system formed | April 25, 2020 | ||||
| Last system dissipated | November 19, 2020 | ||||
| Strongest system | |||||
| Name | Marie | ||||
| Maximum winds | 140 mph (220 km/h) (1-minute sustained) | ||||
| Lowest pressure | 945 mbar (hPa; 27.91 inHg) | ||||
| Longest lasting system | |||||
| Name | Douglas | ||||
| Duration | 8 days | ||||
| |||||
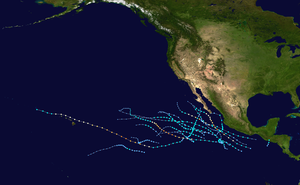
The 2020 Pacific hurricane season was an event in the annual cycle of tropical cyclone formation, in which tropical cyclones form in the Eastern Pacific Ocean. The season officially started on May 15 in the Eastern Pacific—east of 140°W—and began on June 1 in the Central Pacific—the region between the International Date Line and 140°W–and ended on November 30. These dates typically cover the period of each year when most tropical cyclones form in the Eastern Pacific basin according to the National Hurricane Center.[nb 1][1] However, tropical cyclones sometimes form outside the bounds of an official season, as was evidenced by the formation of Tropical Depression One-E on April 25. The season effectively ended with the dissipation of its final storm, Tropical Storm Polo, on November 19.
The formation of One-E on April 25 marked the earliest start to a Pacific hurricane season on record. However, seasonal activity as a whole was generally below average. The season featured 16 named storms, in line with the 1981–2010 long-term average of 15. It featured just four hurricanes, or half the average. Three of those hurricanes intensified into major hurricanes,[nb 2] which compares to the average of four. A few storms produced substantial impact to land in 2020. In May, Tropical Storm Amanda caused widespread damage and killed numerous people in El Salvador, Guatemala, and Honduras.[3] In August, the remnants of Tropical Storm Fausto sparked devastating wildfires across Northern California,[4] while Genevieve produced hurricane-force winds and caused additional fatalities in the Baja California peninsula.[5] Lesser but still deadly effects were produced there by Tropical Storm Hernan as well.[6] A month prior, Hurricane Douglas passed very close to Oahu, though it caused only minor impact.[7]
This timeline documents tropical cyclone formations, strengthening, weakening, landfalls, extratropical transitions, and dissipations during the season. It includes information that was not released throughout the season, meaning that data from post-storm reviews by the National Hurricane Center, such as a storm that was not initially warned upon, has been included.
By convention, meteorologists use one time zone when issuing forecasts and making observations: Coordinated Universal Time (UTC), and also use the 24-hour clock (where 00:00 = midnight UTC).[8] Tropical cyclone advisories in the Eastern North Pacific basin use both UTC and the nautical time zone where the center of the tropical cyclone is currently located. Time zones utilized (east to west) are: Central, Mountain, Pacific and Hawaii. In this timeline, all information is listed by UTC first, with the respective regional time zone included in parentheses. Additionally, figures for maximum sustained winds and position estimates are rounded to the nearest 5 units (knots, miles, or kilometers), following National Hurricane Center practice. Direct wind observations are rounded to the nearest whole number. Atmospheric pressures are listed to the nearest millibar and nearest hundredth of an inch of mercury.
- ^ a b "Tropical Cyclone Climatology". Miami, Florida: National Hurricane Center. Retrieved January 23, 2022.
- ^ "Saffir-Simpson Hurricane Wind Scale". Miami, Florida: National Hurricane Center. Retrieved August 6, 2020.
- ^ Cite error: The named reference
EP022020was invoked but never defined (see the help page). - ^ "Moisture from Tropical Storm Fausto fuels NorCal thunderstorms". Los Angeles Times. August 16, 2020. Retrieved January 23, 2022.
- ^ Cite error: The named reference
Gtcrwas invoked but never defined (see the help page). - ^ Cite error: The named reference
Htcrwas invoked but never defined (see the help page). - ^ Ron Brackett (July 27, 2020). "Hurricane Douglas Blows by Hawaii, Leaving Little Damage Behind". Atlanta, Georgia: The Weather Channel. Retrieved January 23, 2022.
- ^ "Understanding the Date/Time Stamps". Miami, Florida: National Hurricane Center. Retrieved July 20, 2022.
Cite error: There are <ref group=nb> tags on this page, but the references will not show without a {{reflist|group=nb}} template (see the help page).
